Hygiene Department Benchmarks: Is Your Hygiene Schedule Supporting Growth?
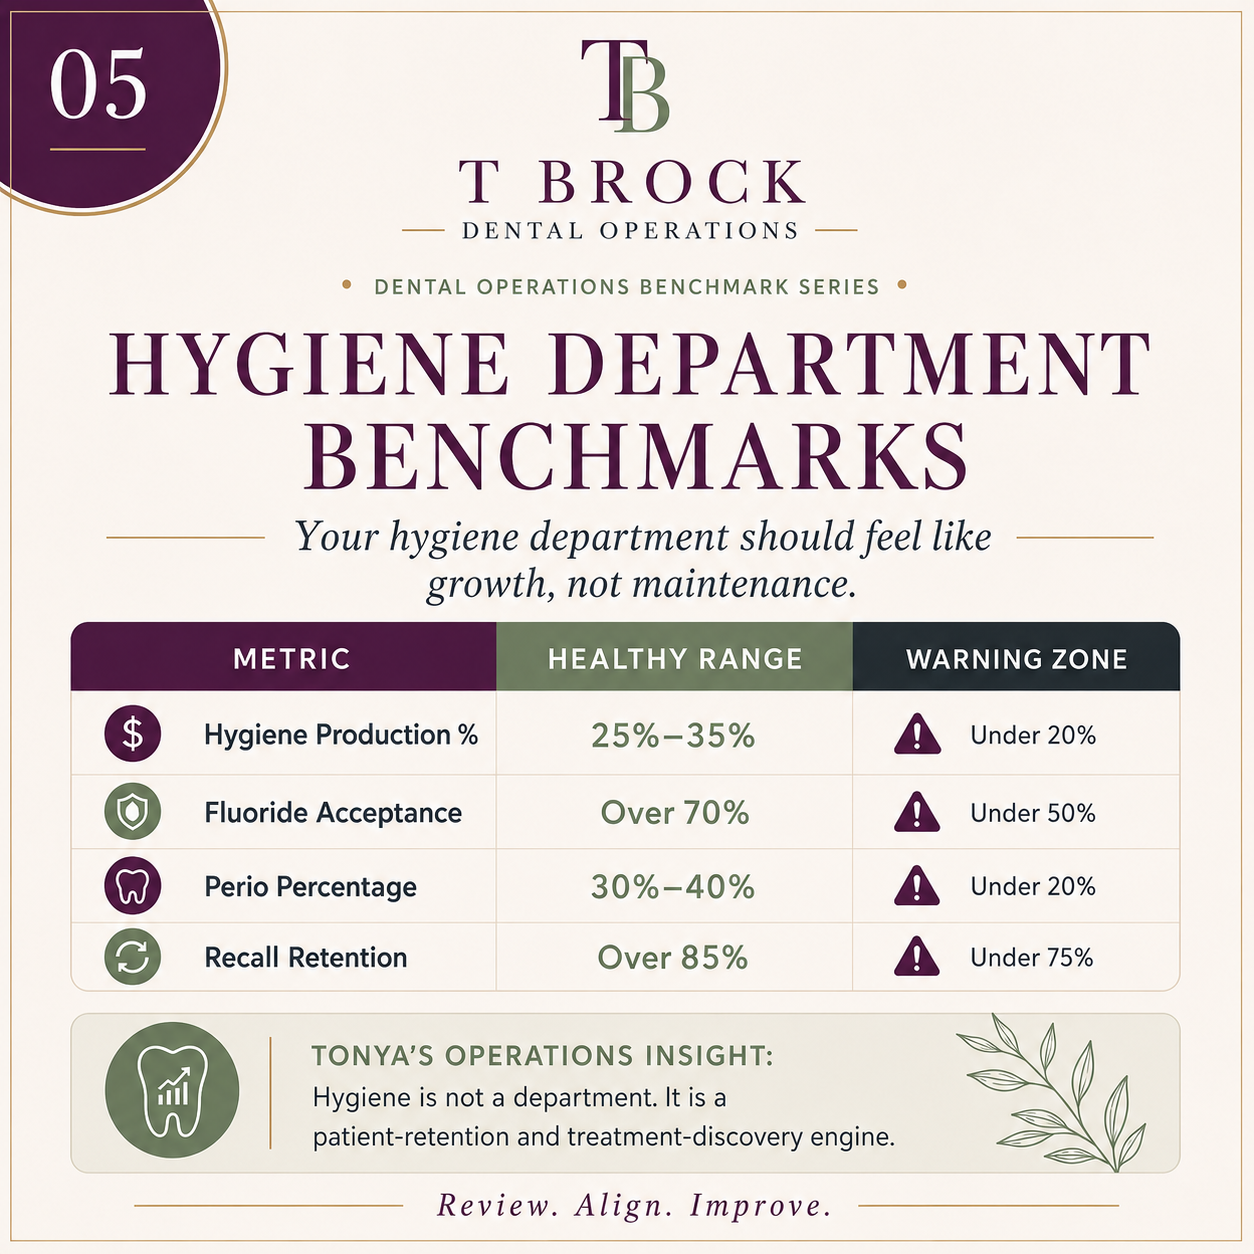
Your hygiene department should be more than a maintenance schedule.
In a healthy dental practice, hygiene supports patient retention, preventive care consistency, perio identification, treatment discovery, and long-term practice growth.
But here is where many practices get tripped up:
A hygiene schedule can look full on paper and still be underperforming.
A packed column does not always mean the department is producing well, retaining patients consistently, identifying periodontal needs appropriately, or helping uncover future restorative opportunities.
That is why hygiene benchmarks matter.
They give the practice a clearer way to review whether the hygiene department is simply staying busy or truly supporting the health of the business.
⸻
Key Hygiene Department Benchmarks to Review
These are four important hygiene metrics every dental practice should be watching:
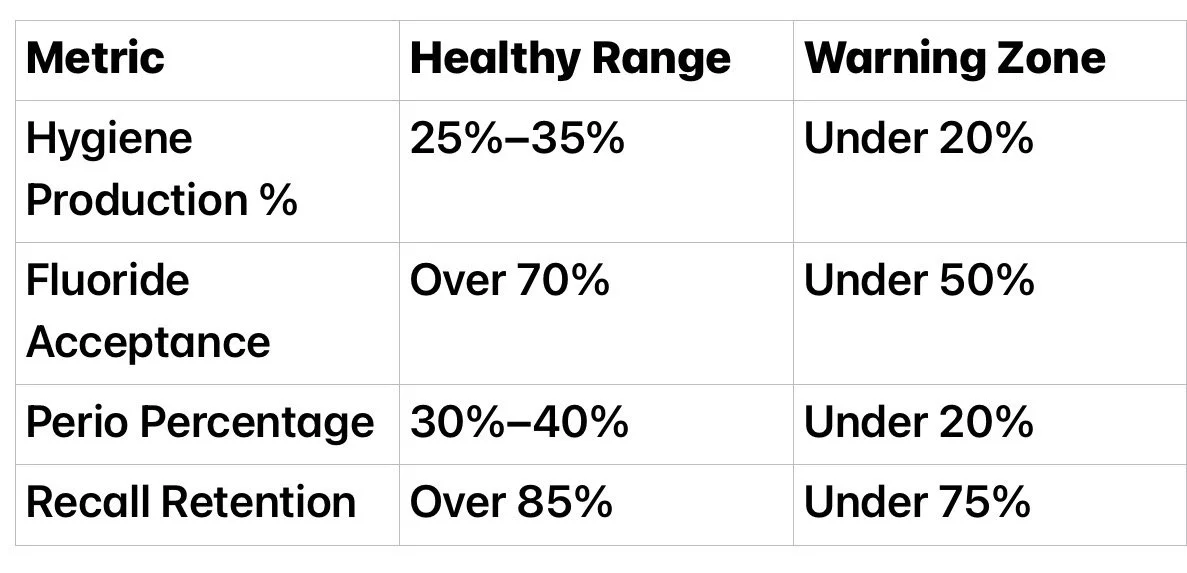
These numbers are not meant to create panic. They are meant to create awareness.
When a hygiene department is below benchmark, the issue is not always the hygienist. Sometimes the real problem is buried in scheduling, diagnosis flow, patient education, handoffs, recall systems, insurance communication, or inconsistent follow-up.
The numbers simply help point the flashlight in the right direction.
Hygiene Production %
Hygiene production is one of the clearest indicators of whether the department is contributing appropriately to overall practice performance.
A healthy hygiene department typically produces around 25%–35% of total practice production.
When hygiene production drops below 20%, it may be time to review:
Recall schedule strength
Perio diagnosis consistency
Fluoride and preventive recommendations
Cancellation and no-show patterns
Hygiene appointment structure
Restorative discovery from hygiene visits
Hygiene should not feel like a separate island inside the practice. It should be connected to the full patient care journey.
Fluoride Acceptance
Fluoride acceptance is a useful indicator of how well the team communicates prevention.
A healthy target is typically over 70% acceptance, with anything under 50% needing review.
Low fluoride acceptance may point to inconsistent language, unclear patient education, team discomfort discussing cost, or weak handoffs between clinical and administrative team members.
Many times, patients are not rejecting care. They simply have not been given a clear reason to value it.
Perio Percentage
Perio percentage helps show whether periodontal disease is being identified, diagnosed, and treated consistently.
A healthy range is often 30%–40%, depending on the patient base, clinical philosophy, payer mix, and practice model.
If perio percentage is under 20%, the practice may need to review:
Periodontal charting consistency
Diagnostic criteria
Hygiene calibration
Patient education language
Treatment presentation
Recare and maintenance systems
This is one of those numbers that tells a deeper story. It is not just about production. It is about whether patients are receiving the level of care they actually need.
Recall Retention
Recall retention is one of the strongest indicators of long-term practice stability.
A healthy recall retention rate is typically over 85%.
When recall retention drops below 75%, the practice may begin feeling pressure in other areas, including hygiene openings, reduced patient touchpoints, fewer restorative opportunities, and weaker patient loyalty.
Recall is not just a schedule filler.
It is the rhythm section of the practice.
When recall is strong, the practice has steadier patient flow, stronger relationships, and better visibility into future treatment needs.
Tonya’s Operations Insight
Hygiene is not just a department. It is a patient-retention and treatment-discovery engine.
When hygiene benchmarks are healthy, the entire practice feels it.
The schedule flows better.
Patients stay connected.
Treatment needs are identified earlier.
The team has better rhythm.
The practice has stronger long-term stability.
When those benchmarks start drifting, the impact rarely stays in hygiene. It shows up in production, patient experience, schedule flow, case discovery, and overall practice performance.

Final Thought
A healthy hygiene department should feel organized, intentional, and connected to the bigger practice picture.
Review the numbers.
Align the systems.
Improve the flow.
That is where better operations begin.
⸻
Benchmark Methodology Disclaimer
These operational benchmarks represent commonly accepted performance ranges observed across private dental practices. Actual targets may vary depending on specialty, practice size, payer mix, geographic market, provider mix, growth stage, and business objectives. These benchmarks are intended for educational and strategic planning purposes only and should not be interpreted as financial, legal, clinical, or regulatory advice.
Want a clearer look at where your practice may be losing momentum?
T Brock Dental Operations helps dental practices review systems, identify operational gaps, and create a more organized path forward.
Contact me to discuss how we can scale your practice to keep your peace.
