AR & Collections Benchmarks: How Healthy Is Your Revenue Follow-Up?
Production may generate revenue, but consistent follow-up is what turns that production into collected income.
A practice can appear busy, productive, and financially stable while quietly carrying an accounts receivable problem beneath the surface. Claims remain untouched, patient balances age, small billing errors compound, and the team becomes accustomed to working from whichever account feels most urgent that day.
That is why accounts receivable should never be reviewed as one large dollar amount alone.
The age of the balances, the party responsible, the reason payment is delayed, and the consistency of follow-up all help reveal whether the practice has a healthy revenue cycle—or a workflow that needs attention.
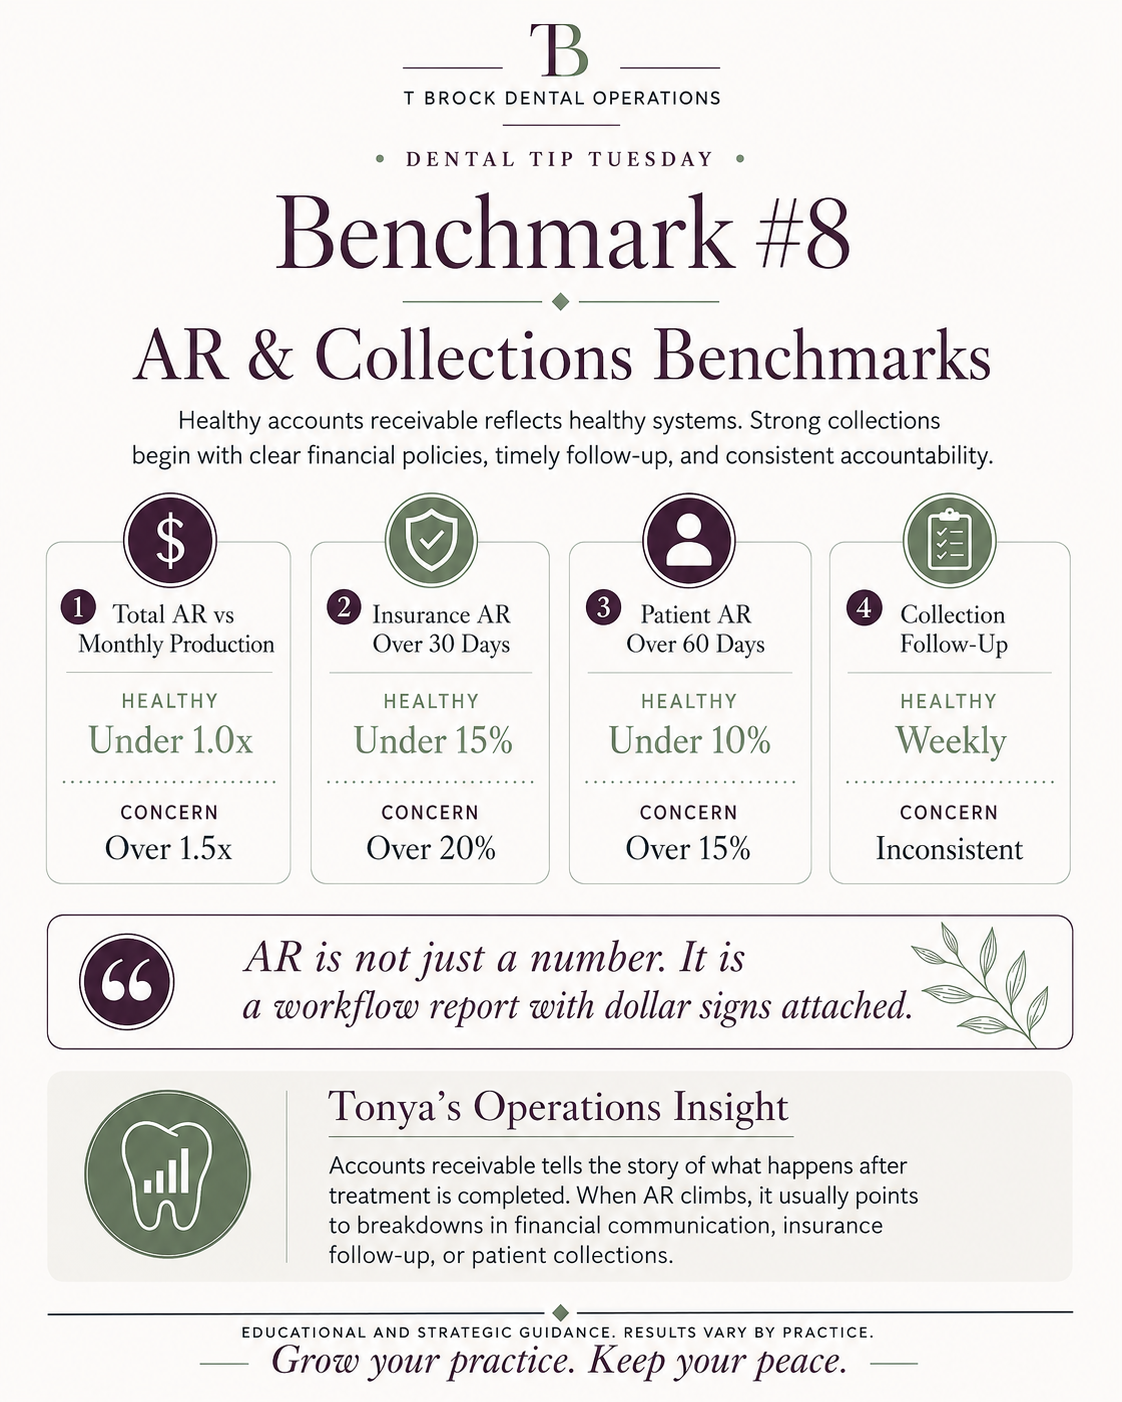
This Week’s Benchmark
Healthy operational targets:
Total accounts receivable below 1.0 times average monthly production
Insurance AR over 30 days below 15%
Patient AR over 60 days below 10%
Collection follow-up completed weekly
Warning signs:
Total AR exceeds 1.5 times average monthly production
Insurance AR over 30 days exceeds 20%
Patient AR over 60 days exceeds 15%
Follow-up is inconsistent, reactive, or undocumented
These benchmarks are not meant to judge the team. They are meant to help leadership recognize where revenue may be slowing down and where the underlying workflow needs support.
Benchmark #8
Why Total AR Does Not Tell the Whole Story
A single accounts receivable total can be misleading.
For example, two practices may each have $150,000 in outstanding AR, but their financial positions could be completely different.
One practice may produce $200,000 per month and have most of its balances under 30 days. The second may produce $90,000 per month and carry a significant portion of its balances beyond 90 days.
The dollar amount is the same. The operational risk is not.
Comparing total AR to average monthly production provides needed context. Keeping total AR below one month of production generally indicates that payments are moving through the revenue cycle at a healthy pace.
Once total AR begins exceeding 1.5 times monthly production, leadership should look beyond the total and determine exactly where the money is becoming delayed.
Insurance AR Over 30 Days
Most insurance claims should not sit untouched for more than 30 days.
An insurance balance reaching that age does not always mean the carrier is refusing to pay. It may indicate:
A claim was never received
An attachment or narrative is missing
The claim was rejected but not corrected
Additional information was requested
The payment was issued but not posted
The claim requires an appeal
No one has completed the next follow-up step
When insurance AR over 30 days rises above 15%, the practice may be developing a follow-up backlog. When it exceeds 20%, the problem deserves prompt operational attention.
The goal is not simply to make more phone calls. The goal is to identify the reason each claim remains unpaid and assign a clear next action.
Patient AR Over 60 Days
Patient balances become more difficult to collect as they age.
Balances may remain outstanding because insurance processed differently than expected, the patient did not understand their estimated portion, a statement was not received, or the team did not discuss payment expectations before treatment.
When more than 10% of patient AR is over 60 days, the practice should review both its collection process and the earlier steps that created the balance.
This includes:
Financial policy communication
Insurance estimates
Payment collection at the time of service
Statement timing and accuracy
Text, email, or telephone follow-up
Payment arrangement documentation
Escalation procedures for older balances
Patient AR is not only a collections issue. It can also be a sign that expectations were unclear before treatment began.
Weekly Follow-Up Creates Control
Healthy AR management requires a consistent rhythm.
Waiting until the end of the month—or until cash flow becomes uncomfortable—creates unnecessary pressure and allows correctable problems to age.
A weekly workflow should include:
Reviewing newly rejected or denied claims
Following up on insurance claims over 30 days
Identifying claims awaiting documentation or clinical information
Reviewing patient balances over 30, 60, and 90 days
Documenting every contact and next action
Assigning responsibility and a follow-up date
Reporting trends or recurring obstacles to leadership
The purpose of this process is not to keep the team busy. It is to keep every outstanding balance moving toward resolution.
What the Aging Report May Be Telling You
Accounts receivable is often treated as a collections report, but it is also an operational diagnostic tool.
A growing aging report may expose breakdowns in:
Insurance verification
Benefit interpretation
Claim submission
Documentation
Payment posting
Financial arrangements
Team training
Accountability
Workflow capacity
If the same carrier, procedure, provider, or denial reason appears repeatedly, the issue may not be follow-up alone. The practice may need to correct the process that is creating the balance.
Collecting old money is important. Preventing the same revenue leak from recurring is where lasting improvement begins.
Tonya’s Operations Insight
AR is not just a number. It is a workflow report with dollar signs attached.
Every aging balance has a history.
Something happened—or failed to happen—before that account reached the aging report. Strong AR management follows the balance backward, identifies the breakdown, and strengthens the workflow so the same issue does not continue.
A Simple Leadership Review
Practice owners and leaders do not need to personally work every aging account. They do, however, need visibility into the health of the process.
During your next AR review, ask:
What is our total AR compared with average monthly production?
What percentage of insurance AR is over 30 days?
What percentage of patient AR is over 60 days?
Which aging category is growing?
What are the most common causes of delayed payment?
Is every outstanding balance assigned a next action?
Is follow-up being completed and documented weekly?
Are we correcting recurring workflow problems—or repeatedly working around them?
These questions shift the conversation from “How much money is outstanding?” to “Why is it outstanding, and what are we doing next?”
Review. Align. Improve.
You do not need to rebuild the entire revenue cycle in one day.
Begin by confirming the accuracy of the aging report. Separate insurance balances from patient balances. Identify the oldest and highest-risk accounts. Then establish a weekly follow-up rhythm that gives every account a clear owner, documented action, and next review date.
Small, consistent improvements create more control than occasional collection pushes driven by urgency.
If your AR continues to grow despite the team’s effort, the problem may not be a lack of effort. It may be a workflow that needs to be reviewed, clarified, and rebuilt.
T Brock Dental Operations helps independent dental practices identify revenue-cycle breakdowns, strengthen accountability, and create practical systems that teams can consistently maintain.
Ready to understand what your AR is really telling you?
These operational benchmarks represent commonly accepted performance ranges observed across private dental practices. Actual targets may vary depending on specialty, practice size, payer mix, geographic market, and business objectives. These benchmarks are intended for educational and strategic planning purposes and should not be interpreted as financial, legal, or regulatory advice.