PRACTICE CAPACITY & CHAIR UTILIZATION
How Much Opportunity Is Hiding in Your Available Capacity?
What Is Open Chair Time Really Costing the Practice?
A dental practice can appear busy while valuable clinical capacity remains unused.
The phones are ringing. The team is moving. The schedule looks full at first glance. Yet beneath that activity, open chair time, poorly aligned appointment blocks, provider bottlenecks, and underused operatories may be quietly limiting production.
Capacity is not determined by the number of chairs inside the building. It is determined by how effectively the practice aligns its available clinical hours, providers, team members, operatories, and patient demand.
A practice may have enough patients and enough treatment opportunities—but still fail to convert those resources into productive clinical time.
PRACTICAL CAPACITY GUIDEPOSTS
Clinical Capacity Utilization
Guidepost: 85–90%
Divide completed clinical hours by the total clinical hours available. Consistently low utilization may reveal scheduling gaps, unfilled provider time, staffing limitations, or treatment that never reaches the schedule.
Schedule Fill Rate
Guidepost: 90% or higher
Measure scheduled clinical hours against available provider hours. Review this before the week begins—not only after lost time can no longer be recovered.
Open Chair Time
Guidepost: Less than 10%
Track unfilled clinical time by provider, day, operatory, and appointment type. A monthly total may identify the loss, but the daily patterns reveal its cause.
On-Time Clinical Starts
Guidepost: 90% or higher
Frequent late starts create a ripple effect across the entire day. Track appointments beginning within the practice’s defined acceptable window, such as ten minutes from the scheduled start time.
Production per Available Clinical Hour
Guidepost: Practice-specific goal
Divide total production by the clinical hours made available—not merely the hours that were filled. This exposes whether the practice’s available capacity is supporting its financial goals.
WHERE CAPACITY IS OFTEN LOST
Available capacity can disappear through:
• Appointment blocks that do not reflect actual procedure demand
• Provider time that is available but never intentionally filled
• Operatories that exist but cannot be used because staffing is misaligned
• Procedures scheduled for more or less time than they consistently require
• Late starts, extended turnovers, and avoidable interruptions
• Unscheduled treatment that is not connected to available clinical time
• Schedule gaps recognized too late for the team to respond
The answer is not always adding more patients, more hours, or more employees.
Sometimes the practice first needs to understand how its current capacity is being used.
START WITH A FOUR-WEEK CAPACITY REVIEW
Review four consecutive weeks and document:
Total available clinical hours by provider
Total scheduled clinical hours
Total completed clinical hours
Open time by day and appointment type
Production per available clinical hour
Recurring causes of unused or disrupted time
Then look for patterns.
Is one day consistently underfilled? Is hygiene operating at capacity while the doctor schedule has openings? Are rooms available without sufficient clinical support? Are large treatment opportunities waiting while valuable appointment blocks remain unused?
These are operational alignment problems—not simply scheduling problems.
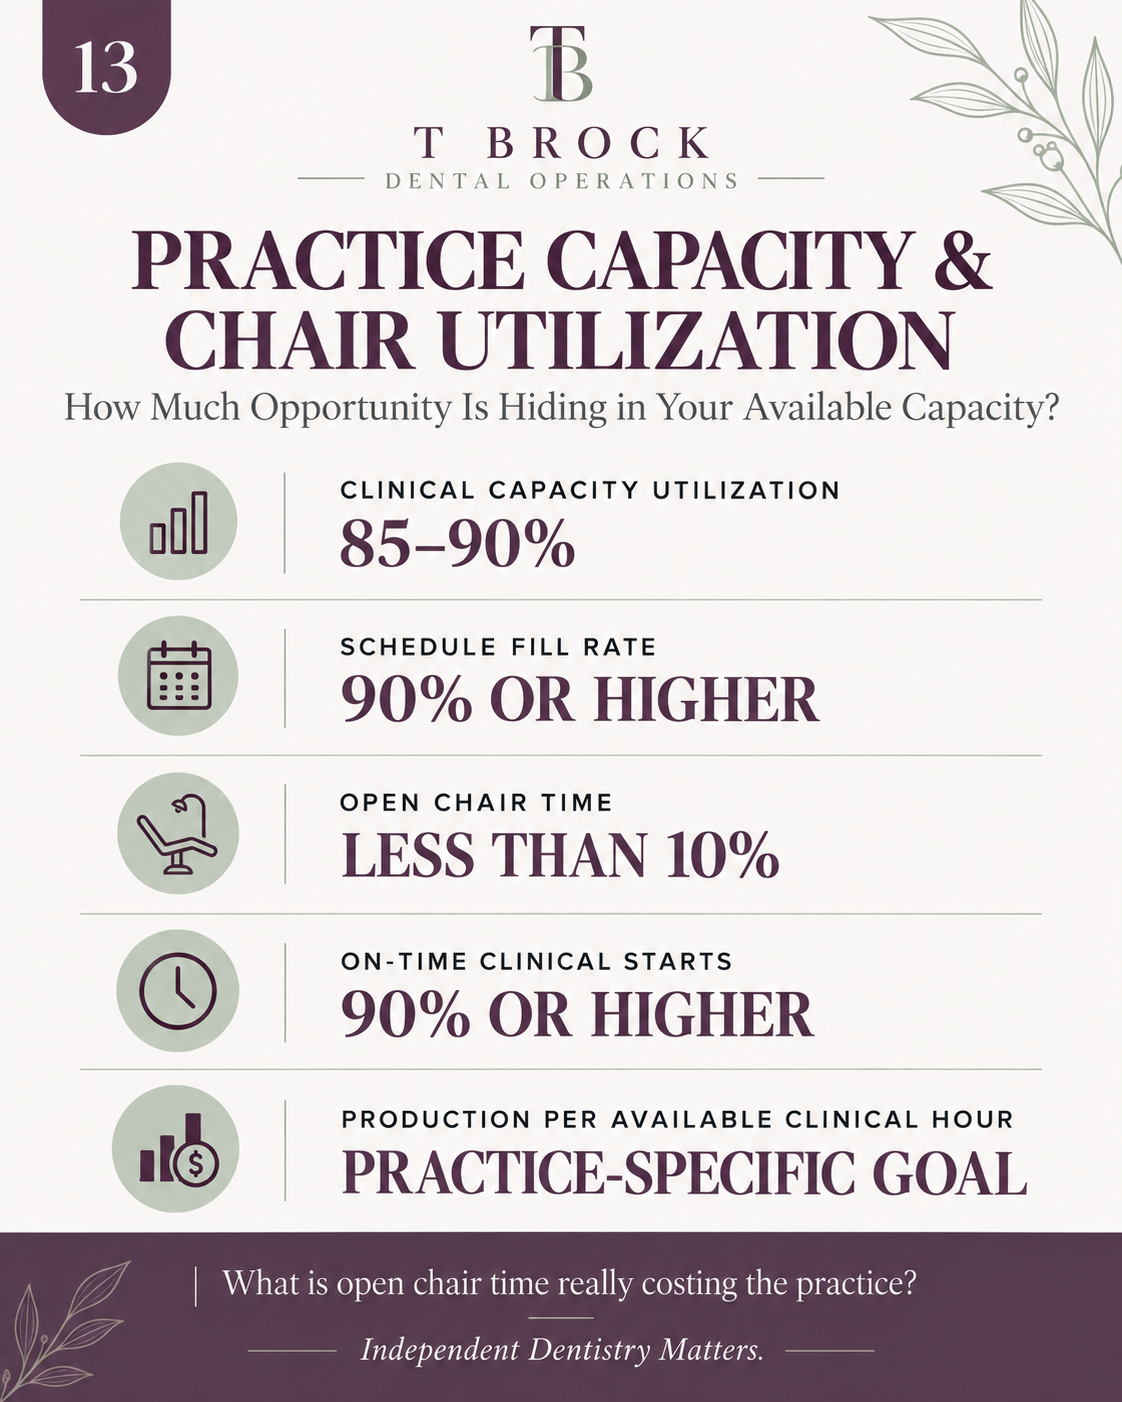
Benchmark #13 examines:
🖤 Clinical capacity utilization
🖤 Schedule fill rate
🖤 Open chair time
🖤 On-time clinical starts
🖤 Production per available clinical hour
THE EXECUTIVE PERSPECTIVE
A full schedule is not the goal. An intentionally designed schedule that uses the practice’s people, time, and clinical resources responsibly is the goal.
Before expanding hours, adding operatories, or hiring another provider, determine whether the practice is fully using the capacity it already has.
The opportunity may already be inside the building.
T Brock Dental Operations
Independent Dentistry Matters.
Benchmark Disclaimer: These figures are practical operational guideposts, not universal industry standards. Appropriate targets vary according to practice model, specialty, payer mix, provider mix, procedure mix, staffing structure, operating hours, location, and growth stage.